28 February, 2025
Government Efficiency and Budget Savings Report
The Department of Government Efficiency (DOGE) reports an estimated $65 billion in federal savings achieved to date through its cost-cutting initiatives. These savings are derived from a combination of measures such as enhanced fraud detection and deletion of improper payments, cancellation or renegotiation of contracts and leases, sale of unneeded assets, grant cancellations, workforce reductions, programmatic adjustments, and regulatory reforms.
DOGE – led by Senior Advisor Elon Musk – was established with the mandate to weed out waste, fraud, and abuse in federal programs. The department has committed to full transparency in its operations, noting that all data on savings and cuts will be uploaded in a digestible and fully transparent manner with clear documentation of assumptions, in accordance with applicable rules and regulations.
This report provides an official update on DOGE’s efficiency efforts and places them in context of recent federal spending, revenue, and deficit trends.
US taxpayer dollars were going to be spent on the following items, all which have been cancelled:
- $60M for “Indigenous Peoples and Afro-Colombian empowerment”
- $74M for “inclusive justice” in Colombia
- $79M for “primary literacy” in Kenya
- $37M for “female empowerment” in Colombia
- $8M to “Reduce stigma, discrimination, and violence against LGBTQI+ communities” in Lesotho
- $3.3M for “being LGBTQI in the Caribbean”
- $25k to increase “Vegan Local Climate Action Innovation” in Zambia

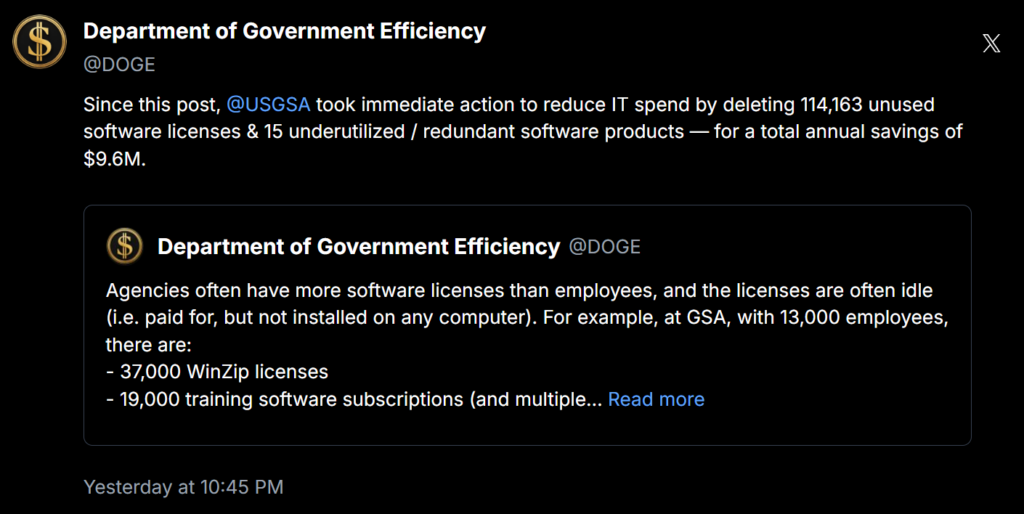
Agencies often have more software licenses than employees, and the licenses are often idle (i.e. paid for, but not installed on any computer). For example, at GSA, with 13,000 employees, there are:
- 37,000 WinZip licenses
- 19,000 training software subscriptions (and multiple parallel training software platforms)
- 7,500 project management software seats for a division with 5,500 employees
- 3 different ticketing systems running in parallel
- 380 Microsoft 365 licenses with zero users
- 128 Microsoft Teams conference room licenses; only installed in 30 rooms
- 250 VSCode licenses; only using 33
- 129 Photoshop licenses; only using 22.
- 5 cybersecurity licenses, each with > 20k seats; DOL headcount is < 15k
Agency Efficiency Leaderboard
As part of its transparency and accountability efforts, DOGE has launched an Agency Efficiency Leaderboard to track savings by agency. This leaderboard ranks agencies by cost savings achieved, normalized relative to each agency’s size and budget to ensure fair comparisons. The top five agencies in terms of savings realized (through canceled contracts and other efficiencies) are the Department of Education (ED), the General Services Administration (GSA), the Environmental Protection Agency (EPA), the Department of Labor (DOL), and the Office of Personnel Management (OPM). These agencies led in identifying reductions and reallocations of resources.
In contrast, the five agencies with the least reported savings are the Department of State, the National Institutes of Health (NIH), the Department of Transportation (DOT), the Department of Energy, and the Department of Commerce.
Agency Efficiency Leaderboard – Top 5 vs. Bottom 5 Agencies by Cost Savings Achieved
| Highest Savings (Top 5) | Lowest Savings (Bottom 5) |
| 1. Department of Education (ED) | 1. Department of State |
| 2. General Services Administration (GSA) | 2. National Institutes of Health (NIH) |
| 3. Environmental Protection Agency (EPA) | 3. Department of Transportation (DOT) |
| 4. Department of Labor (DOL) | 4. Department of Energy (DOE) |
| 5. Office of Personnel Management (OPM) | 5. Department of Commerce |
(Savings are measured in relative terms, taking into account each agency’s budget and mission scope to normalize performance.)
DOGE emphasizes that these rankings are updated regularly as new savings are realized. It also cautions that there may be some discrepancies in reporting (for example, termination of contracts might not immediately reflect in the Federal Procurement Data System due to processing lags). Nonetheless, the leaderboard highlights where efficiency efforts are most effective and where further improvements are needed.
Spending by Selected Agencies, FY 2019 vs FY 2024 (in nominal dollars)
| Agency | FY 2019 Spending | FY 2024 Spending | % Change (2019–24) |
| Department of Health and Human Services (HHS) | $1.235 trillion | $1.700 trillion | +38% |
| Social Security Administration (SSA) | $1.000 trillion | $1.500 trillion | +50% |
| Department of the Treasury | $0.376 trillion | $1.326 trillion | +253% |
| Department of Defense (DoD) | $0.688 trillion | $0.918 trillion | +34% |
| Department of Veterans Affairs (VA) | $0.200 trillion | $0.326 trillion | +63% |
| Department of Education (ED) | $0.135 trillion | $0.272 trillion | +102% |
Sources: OMB/Treasury data
In FY 2019, federal spending totaled approximately $4.4 trillion. Major components of that year’s budget included:
- Social Security: $1.0 trillion (approximately 23% of total outlays)
- National Defense: $687.6 billion (approximately 15%)
- Medicare: $651 billion (approximately 15%)
- Medicaid and Other Health Programs: $584.8 billion
- Income Security Programs: $515.4 billion
- Net Interest on the Public Debt: $375.6 billion
The Department of Health and Human Services (HHS), which administers Medicare, Medicaid, and public health programs, accounted for roughly $1.2 trillion of the 2019 outlays. The Social Security Administration disbursed about $1.0 trillion in retirement and disability benefits. Defense spending, attributed to the Department of Defense, was approximately $688 billion. The Department of the Treasury’s outlays were around $376 billion, primarily due to interest costs on federal debt.
By FY 2024, total federal expenditures had risen to $6.75 trillion (actual). Every major agency saw higher spending levels. HHS spending grew to $1.70 trillion in 2024, reflecting increased costs for Medicare, Medicaid, public health programs, and pandemic-related health expenditures. The Social Security Administration’s outlays rose to $1.50 trillion as a result of higher benefits payouts (due in part to cost-of-living adjustments and an expanding beneficiary population). Department of Defense spending in 2024 reached roughly $918 billion, sustaining a larger military budget and new defense initiatives (DoD accounted for about 13.5% of federal expenditures in 2024). Notably, the Department of the Treasury’s spending jumped to approximately $1.33 trillion in 2024, a significant increase largely driven by a sharp rise in interest payments on the national debt (due to higher debt levels and interest rates). Other agencies also saw substantial increases: for example, the Department of Veterans Affairs grew to about $326 billion in 2024, up from $200 billion in 2019, reflecting expanded veterans’ healthcare and benefits. The Department of Education’s spending roughly doubled to about $272 billion in 2024 (from $135 billion in 2019), due in part to pandemic relief funding for schools and students. These trends illustrate that while DOGE’s efficiency measures have curbed some wasteful spending, overall federal outlays have grown significantly in recent years.
Revenue Sources
Federal revenues have also grown from FY 2019 to FY 2024, though at a more moderate pace than spending. In FY 2019, the government collected about $3.5 trillion in total revenue. Table 3 provides a breakdown of major revenue sources in FY 2019 and FY 2024, along with their percentage change:
Table 3: Major Federal Revenue Streams in FY 2019 vs FY 2024
| Revenue Source | FY 2019 Receipts | FY 2024 Receipts | % Change (2019–24) |
| Individual Income Taxes | $1.70 trillion | $2.40 trillion | +41.2% |
| Social Insurance (Payroll) Taxes* | $1.20 trillion | $1.70 trillion | +41.7% |
| Corporate Income Taxes | $0.23 trillion | $0.53 trillion | +130.4% |
| Other Revenues** | $0.33 trillion | $0.26 trillion | -21.2% |
| Total Revenue | $3.5 trillion | $4.9 trillion | +40.3% |
Social Insurance Taxes primarily include Social Security and Medicare payroll taxes.
“Other Revenues” include sources such as excise taxes, customs duties, estate and gift taxes, Federal Reserve earnings, fees, and other miscellaneous receipts.
By FY 2024, total federal receipts reached $4.919 trillion, a nominal increase of 15.8% from pre-pandemic levels (FY 2019). This growth was primarily driven by:
- Individual Income Taxes: Rose to approximately $2.4 trillion (49% of total revenue), reflecting higher incomes and the expiration of some tax benefits.
- Payroll Taxes: Increased to roughly $1.7 trillion (35% of total revenue), due to employment and wage growth.
- Corporate Income Taxes: More than doubled to about $530 billion (11% of total revenue), driven by surging corporate profits.
- Other Revenue Sources: Declined to around $262 billion (5% of revenue). This decrease was partly due to reduced Federal Reserve remittances (resulting from losses on its bond portfolio) and the reduction of certain tariffs and fees.
While total receipts increased by approximately 40% from 2019 to 2024, this growth was outpaced by the significantly larger increase in federal spending.
By 2024, total federal receipts had risen to $4.919 trillion (actual), which is about 15.8% higher than in FY 2019 (before the pandemic) in nominal terms. The revenue growth was driven largely by increases in individual and corporate tax collections. Individual income taxes reached roughly $2.4 trillion in FY 2024, accounting for about 49% of total revenue. This increase reflects higher incomes and the expiration of certain tax benefits, which boosted individual tax receipts. Payroll taxes climbed to approximately $1.7 trillion in 2024 (about 35% of total revenue), due to growth in employment and wages over the period. Notably, corporate income tax receipts more than doubled to about $530 billion in 2024, roughly 11% of total revenues, as corporate profits surged in the post-2019 period. Meanwhile, other revenue sources declined in aggregate by 2024, contributing around $262 billion (5% of revenue). This “other” category was lower partly because of a drop in remittances from the Federal Reserve (the Fed’s interest earnings turned down in 2023–2024 as it incurred losses on its bond portfolio, reducing payments to Treasury) and the winding down of certain tariffs and fees. Overall, revenue growth (about 40% in total receipts from 2019 to 2024) has been substantial but has not kept pace with the much larger increase in spending over the same period.
Federal Deficit Analysis
The federal budget deficit (the shortfall of revenue relative to spending) widened significantly between FY 2019 and FY 2024. In FY 2019, the U.S. ran a deficit of $984 billion. This amounted to roughly 4.6% of GDP in that year. By FY 2024, the deficit had grown to approximately $1,833 billion, or about 6.4% of GDP. This is an 85.9% increase in the nominal deficit from 2019 to 2024, nearly doubling the annual gap (Table 4).
U.S. Federal Budget Deficit in FY 2019 and FY 2024
| Fiscal Year | Federal Deficit (in USD) | % Change vs FY 2019 |
| FY 2019 | $984 billion | – |
| FY 2024 | $1,833 billion | +85.9% |
The deficit expansion reflects the fact that expenditures grew far more rapidly than revenues over this five-year span. Federal spending in FY 2024 was roughly $2.35 trillion higher than in FY 2019, while revenues were about $1.4 trillion higher. The spike in spending was driven by several factors, notably the emergency fiscal responses to the COVID-19 pandemic (especially in FY 2020–2021) which elevated outlays for economic stimulus, healthcare, and income support programs. Although some pandemic-related spending had tapered by 2024, many outlays (particularly for social programs, healthcare, and interest on debt) remained well above pre-2019 levels, as documented earlier in this report. On the revenue side, tax receipts also increased (especially in FY 2021–2022 with a strong economic recovery), but they did not increase enough to offset the surge in spending. The result was a much larger deficit in 2024. In short, the annual deficit nearly doubled, underscoring growing fiscal imbalances.
It is noteworthy that the FY 2024 deficit, while large, is lower than the peak deficits seen during the height of the pandemic (for instance, the FY 2020 deficit exceeded $3.1 trillion). By 2024, the deficit had come down from those record highs as emergency spending receded and revenues recovered. However, at $1.833 trillion, the 2024 shortfall is still historically high and indicates that the nation’s debt path remains on an upward trajectory. Absent changes to spending or revenue policies, these deficits add to the federal debt and increase the government’s interest payment obligations in future budgets.
Agency Spending
| Agency | FY2019 | FY2024 |
|---|---|---|
| Department of Health and Human Services | $1213.8B | $1720.6B |
| Social Security Administration | $1101.8B | $1519.7B |
| Department of the Treasury | $689.5B | $1311.9B |
| Department of Defense | $654.0B | $826.3B |
| Department of Veterans Affairs | $199.6B | $325.0B |
| Department of Education | $104.4B | $268.4B |
| Department of Agriculture | $150.1B | $203.4B |
| Office of Personnel Management | $103.1B | $126.2B |
| Department of Transportation | $80.7B | $117.4B |
| Department of Homeland Security | $56.3B | $89.3B |
| Independent Agencies | $19.6B | $77.8B |
| Other Defense Civil Programs | $60.9B | $66.2B |
| Department of Labor | $35.8B | $65.7B |
| Department of Housing and Urban Development | $29.2B | $52.0B |
| Department of Energy | $28.9B | $49.3B |
| Department of Justice | $35.1B | $44.0B |
| Department of State | $28.0B | $37.0B |
| International Assistance Programs | $23.6B | $35.8B |
| Small Business Administration | $0.5B | $33.2B |
| National Aeronautics and Space Administration | $20.2B | $25.0B |
| Department of the Interior | $13.9B | $17.1B |
| Department of Commerce | $11.3B | $14.7B |
| Environmental Protection Agency | $8.1B | $13.7B |
| Corps of Engineers | $6.5B | $11.3B |
| Judicial Branch | $8.0B | $9.5B |
| National Science Foundation | $7.3B | $9.4B |
| Legislative Branch | $5.0B | $6.8B |
| Executive Office of the President | $0.4B | $0.6B |
| General Services Administration | $-1.1B | $-0.2B |
| Undistributed Offsetting Receipts | $-247.8B | $-330.6B |
| Total Spending | $4446.6B | $6746.5B |
| +51.7% change from FY2019 to FY2024 | ||
Revenue Sources
| Source | FY2019 | FY2024 |
|---|---|---|
| Individual Income Taxes | $1718.0B | $2426.0B |
| Corporate Income Taxes | $230.0B | $530.0B |
| Social Insurance Taxes | $1243.0B | $1709.0B |
| Excise Taxes | $99.0B | $101.0B |
| Estate and Gift Taxes | $17.0B | $32.0B |
| Customs Duties | $71.0B | $77.0B |
| Miscellaneous Revenue | $85.0B | $43.0B |
| Total Revenue | $3463.0B | $4918.0B |
| +42.0% change from FY2019 to FY2024 | ||
| FY2019 | FY2024 | |
|---|---|---|
| Federal Deficit | $984.4B | $1830.0B |
| +85.9% change from FY2019 to FY2024 | ||
This report highlights the federal government’s recent efforts and challenges in improving fiscal efficiency and managing the budget. DOGE’s initiatives have yielded substantial savings – about $65 billion so far – by eliminating waste and improving efficiency, demonstrating the potential for reducing costs without undermining agency missions. These savings were achieved through targeted actions like cutting fraudulent payments, cancelling unnecessary contracts, and streamlining operations, and they contribute to a culture of fiscal responsibility in government.
However, the analysis of spending, revenue, and deficit trends from FY 2019 to FY 2024 shows that much larger budgetary forces are at play. Over five years, federal spending grew by over 50%, far outpacing the roughly 16% growth in revenues. Key drivers were mandatory programs (such as Social Security, Medicare/Medicaid, and veterans’ benefits) and interest costs, as well as one-time emergency expenditures, which together led to record-high outlays. Revenues also increased (reaching nearly $4.9 trillion in 2024, an all-time high), thanks to economic growth and higher tax receipts, but not by enough to prevent a widening deficit. Consequently, the annual federal deficit nearly doubled between 2019 and 2024, underscoring the structural challenge of aligning expenditures with revenues.
Moving forward, the federal government – through DOGE and other initiatives – is continuing efforts to improve efficiency, eliminate waste, and enhance budget transparency. Such efforts are crucial to ensure that taxpayer dollars are used effectively and to help slow the growth of the deficit. The Department of Government Efficiency will build on the successes outlined in this report by identifying further savings opportunities across agencies and programs. These actions, combined with broader fiscal policy decisions by Congress and the Administration, aim to put the federal budget on a more sustainable path. DOGE remains committed to reporting on progress in a transparent manner, so that the public can track how efficiency measures translate into financial savings and how those savings contribute, over time, to a healthier fiscal outlook for the nation.
Overall Report Summary
| Category | Key Findings |
| DOGE Savings | $65 billion in savings achieved through fraud detection, contract renegotiation, asset sales, workforce reductions, and other efficiency measures. |
| Transparency | DOGE commits to full transparency, with data on savings and cuts to be publicly released. |
| Agency Performance | Agency Efficiency Leaderboard ranks departments: |
| Top 5 (Highest Savings): Education, GSA, EPA, Labor, OPM | |
| Bottom 5 (Lowest Savings): State, NIH, Transportation, Energy, Commerce | |
| Federal Spending | Increased significantly (over 50%) from FY 2019 (4.4trillion)toFY2024(4.4trillion)toFY2024(6.75 trillion). |
| – Major Increases: Across all agencies, especially HHS, Social Security, Treasury (interest on debt), Defense, VA, and Education. | |
| Spending by Category | Increased significantly in all categories listed. |
| Spending Change | Spending Increased 51.7% from 2019 to 2024. |
| Federal Revenue | Increased (40%) from FY 2019 (3.5trillion)toFY2024(3.5trillion)toFY2024(4.9 trillion). |
| Drivers: Growth in individual income taxes, corporate income taxes, and payroll taxes. “Other Revenues” declined. | |
| Revenue by Category | Increased significantly in most categories, with the exception of Miscellaneous Revenue. |
| Revenue Change | Revenue Increased 42% from 2019 to 2024. |
| Federal Deficit | Nearly doubled, from $984 billion (FY 2019) to $1.833 trillion (FY 2024). |
| Cause: Spending growth significantly outpaced revenue growth. Driven by pandemic response, mandatory program growth, and interest on debt. | |
| Deficit Change | Deficit Increased 85.9% from 2019 to 2024. |
| Overall Conclusion | DOGE’s cost-cutting efforts yielded substantial savings, but were overshadowed by larger increases in federal spending and a widening budget deficit, highlighting the challenge of achieving long-term fiscal sustainability. |